https://www.datamanim.com/dataset/practice/q3.html
3회차 — DataManim
Toggle in-page Table of Contents
www.datamanim.com
Import
import os
import pandas as pd
import numpy as np
import datetime
from dateutil.relativedelta import relativedelta
!pip install tqdm
import tqdm
import zipfile
import re
from tqdm import tqdm
작업 1유형
import pandas as pd
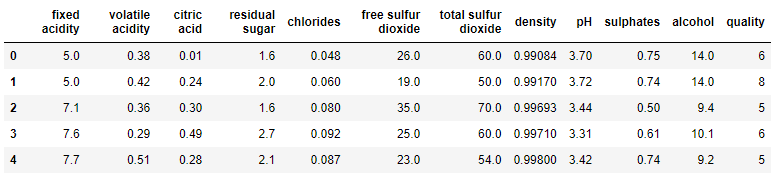
df = pd.read_csv('https://raw.githubusercontent.com/Datamanim/datarepo/main/spotify/spotify.csv')
df.head()
데이터 설명 : 2010-2019 스포티파이 TOP100 노래
Question1
데이터는 현재 년도별 100곡이 인기순으로 정렬되어 있다.
각 년도별 1~100위의 랭킹을 나타내는 rank컬럼을 만들고 매년도 1위의 bpm컬럼의 평균값을 구하여라
lst = list(range(1,11))
lst
lst = list(range(1,11))*2
lst
df = df.dropna()
df.loc[:,'rank'] = list(range(1,101))*10
result = df[df['rank'] ==1].bpm.mean()
print(result)
Question2
2015년도에 가장많은 top100곡을 올린 artist는 누구인가?
result = df[df['top year'] ==2015].artist.value_counts().index[0]
print(result)
Question3
년도별 rank값이 1~10위 까지의 곡들 중 두번째로 많은 top genre는 무엇인가?
result = df[df['rank'].isin(range(1,11))]['top genre'].value_counts().index[2]
print(result)
Question4
피처링의 경우 title에 표시된다. 피처링을 가장 많이 해준 가수는 누구인가?
df.title.str.split('feat.').str[1]
df.title.str.split('feat.').str[1].dropna()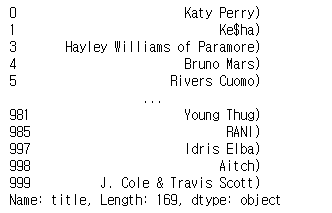
df.title.str.split('feat.').str[1].dropna().str[:-1]
result = df.title.str.split('feat.').str[1].dropna().str[:-1].str.strip().value_counts().index[0]
print(result)
Question5
top year 년도를 기준으로 발매일(year released)과 top100에 진입한 일자 (top year)가 다른 곡의 숫자를 count 했을때 가장 많은 년도는?
year = int(df[df['year released'] != df['top year']]['top year'].value_counts().index[0])
print(year)
Question6
artist 컬럼의 값에 대소문자 상관없이 q 단어가 들어가는 아티스트는 몇명인가?
result = df[df.artist.str.lower().str.contains('q')].artist.nunique()
print(result)
Question7
년도 상관없이 전체데이터에서 1~50위와 51~100위간의 dur 컬럼의 평균값의 차이는?
result = df[df['rank'].isin(range(1,51))].dur.mean() - df[df['rank'].isin(range(51,101))].dur.mean()
print(result)
Question8
title을 띄어쓰기 단어로 구분 했을때 가장 많이 나온 단어는 무엇인가? (대소문자 구분 x)
df.title.str.split('\(feat').str[0]
df.title.str.split('\(feat').str[0].str.split().explode()
result = df.title.str.split('\(feat').str[0].str.split().explode().str.lower().value_counts().index[0]
print(result)
리스트 형태의 값 전개 explode
목록의 각 요소를 행으로 반환하여 인덱스 값을 복제
Question9
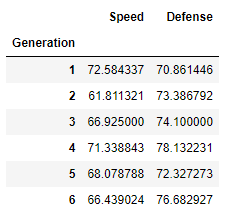
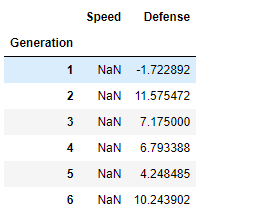
년도별 nrgy값의 평균값을 구할때 최대 평균값과 최소 평균값의 차이를 구하여라
m = df.groupby(['top year']).nrgy.mean().sort_values().values
m
m = df.groupby(['top year']).nrgy.mean().sort_values().values
result = m[-1] - m[0]
print(result)
Question10
artist중 artist type 타입을 여러개 가지고 있는 artist는 누구인가
df[['artist','artist type']].value_counts().reset_index()
df[['artist','artist type']].value_counts().reset_index().artist.value_counts()
result = df[['artist','artist type']].value_counts().reset_index().artist.value_counts().index[0]
print(result)
작업 2유형
import pandas as pd
#데이터 로드
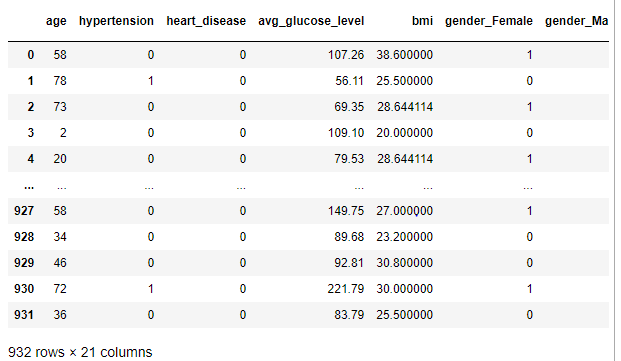
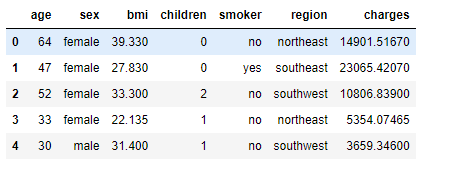
x_train = pd.read_csv("https://raw.githubusercontent.com/Datamanim/datarepo/main/muscle/x_train.csv")
y_train = pd.read_csv("https://raw.githubusercontent.com/Datamanim/datarepo/main/muscle/y_train.csv")
test= pd.read_csv("https://raw.githubusercontent.com/Datamanim/datarepo/main/muscle/x_test.csv")
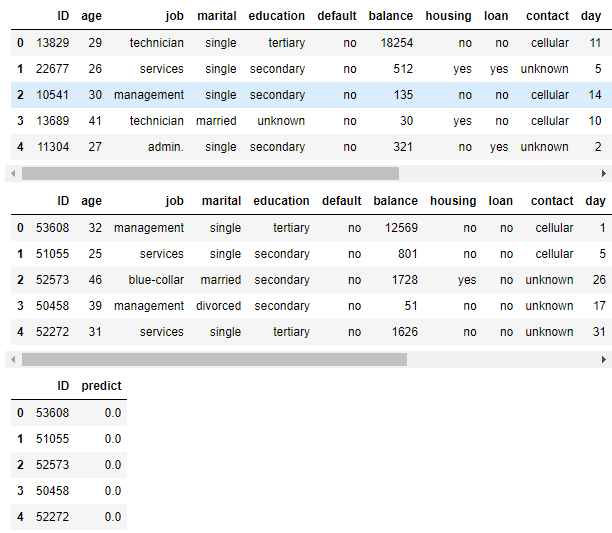
display(x_train.head())
display(y_train.head())
데이터 설명 : 센서데이터로 동작 유형 분류(종속변수 pose : 0, 1 구분)
x = x_train.drop(columns = ['ID'])
test_drop = test.drop(columns = ['ID'])
sc = StandardScaler()
sc.fit(x)
xs = sc.transform(x)
x_test_scaler = sc.transform(test_drop)
scaler fit은 train데이터로, transform은 train, test 데이터
scaler 처리 한다면 train_test_split 처리하기 전에 진행
# train_test_split
X_train, X_test, y_train, y_test = train_test_split(xs, y_train['pose'], test_size = 0.33, random_state = 42)
lr = LogisticRegression()
lr.fit(X_train, y_train)
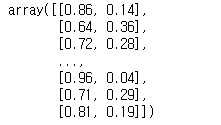
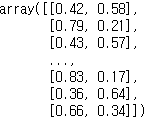
pred = lr.predict_proba(X_test)
print('validation_auc : ', roc_auc_score(y_test, pred[:,1]))
# # 아래 코드 예측변수와 수험번호를 개인별로 변경하여 활용
# # pd.DataFrame({'id': test.id, 'stroke': pred}).to_csv('003000000.csv', index=False)
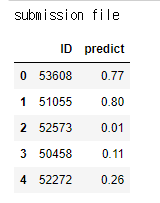
#pd.DataFrame({'id': test.ID, 'pose': lr.predict_proba(x_test_scaler)[:,1]}).to_csv('003000000.csv', index=False)
'빅데이터분석기사 > 모의고사' 카테고리의 다른 글
| 실기 모의고사 2회차 (0) | 2022.08.17 |
|---|---|
| 실기 모의고사 1회차 (0) | 2022.08.17 |