판다스의 핵심 객체 : DataFrame
- DataFrame이란? 여러 개의 행과 열로 이루어진 2차원 데이터를 담는 데이터 구조체
- Index : 개별 데이터를 고유하게 식별하는 key 값
- Series : 칼럼이 하나 뿐인 데이터 구조체
- Series와 DataFrame은 모두 Index를 key값으로 가지고 있음
Titanic : Machine Learning from Disaster
import pandas as pd

titanic_df = pd.read_csv('titanic_train.csv')
print('titanic 변수 type:', type(titanic_df))
titanic_df
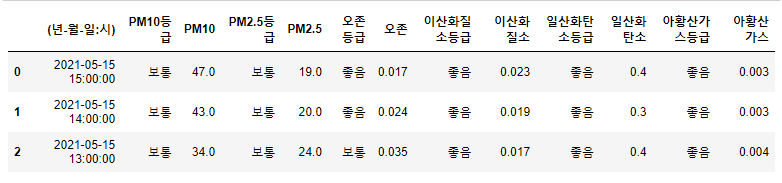
titanic_df.head(3)
print('DataFrame 크기: ', titanic_df.shape)
titanic_df.info()
titanic_df.describe()
- describe() : 해당 숫자 컬럼이 숫자형 카테고리 컬럼인지 판단할 수 있게 도와줌
value_counts = titanic_df['Pclass'].value_counts()
print(value_counts)
- value_counts() : 지정된 칼럼의 데이터값 건수를 반환, 데이터의 분포도를 확인하는데 유용
titanic_pclass = titanic_df['Pclass']
print(type(titanic_pclass))
titanic_pclass.head()
value_counts = titanic_df['Pclass'].value_counts()
print(type(value_counts))
print(value_counts)
print('titanic_df 데이터 건수:', titanic_df.shape[0])
print('기본 설정인 dropna = True로 value_counts()')
print(titanic_df['Embarked'].value_counts())
print(titanic_df['Embarked'].value_counts(dropna=False))
titanic_df['Age_0'] = 0
titanic_df.head(3)
titanic_df['Age_by_10'] = titanic_df['Age']*10
titanic_df['Family_No'] = titanic_df['SibSp'] + titanic_df['Parch'] + 1
titanic_df.head(3)

titanic_df['Age_by_10'] = titanic_df['Age_by_10']+100
titanic_df.head(3)
titanic_drop_df = titanic_df.drop('Age_0', axis=1)
titanic_drop_df.head(3)

titanic_df.head(3)

drop_result = titanic_df.drop(['Age_0', 'Age_by_10', 'Family_No'], axis = 1, inplace = True)
print('inplace=True로 drop 후 반환된 값:', drop_result)
titanic_df.head(3)
- drop()시 inplace=True로 설정하면 반환 값이 None(아무 값도 아님)이 된다, 따라서 inplace=True로 설정한 채로 반환 값을 다시 자신의 DataFrame 객체로 할당하면 안된다.
pd.set_option('display.width', 1000)
pd.set_option('display.max_colwidth', 15)
print('#### before axis 0 drop ####')
print(titanic_df.head(3))

titanic_df.drop([0,1,2], axis = 0, inplace = True)

print('#### after axis 0 drop ####')
print(titanic_df.head(3))
titanic_df = pd.read_csv('titanic_train.csv')
indexes = titanic_df.index
print(indexes)

print('Index 객체 array값:\n', indexes.values)
titanic_reset_df = titanic_df.reset_index(inplace = False)
titanic_reset_df.head(3)

print('### before reset_index ###')
value_counts = titanic_df['Pclass'].value_counts()
print(value_counts)
print('value_counts 객체 변수 타입:', type(value_counts))

new_value_counts = value_counts.reset_index(inplace=False)
print('### After reset_index ###')
print(new_value_counts)
print('new_value_counts 객체 변수 타입:', type(new_value_counts))
DataFrame을 넘파이 ndarrary, 리스트, 딕셔너리로 변환하기
#DataFrame을 ndarray로 변환
array3 = df_dict.values
print('df_dict.values 타입:', type(array3), 'df_dict.values.shape:', array.shape)
print(array3)
#DataFrame을 리스트로 변환
list3 = df_dict.values.tolist()
print('df_dict.values.tolist() 타입:', type(list3))
print(list3)
#DataFrame을 딕셔너리로 변환
dict3 = df_dict.to_dict('list')
print('\n df_dict.to_dict() 타입:', type(dict3))
print(dict3)
데이터 셀렉션 및 필터링
print(titanic_df['Pclass'].head(3))
print(titanic_df[['Survived', 'Pclass']].head(3))
print(titanic_df[0])

titanic_df[0:2]

#불린 인덱싱 표현
titanic_df[titanic_df['Pclass']== 3].head(3)
data = {'Name' : ['Chulmin', 'Eunkyung', 'Jinwoong', 'Soobeom'],
       'Year' : [2011, 2016, 2015, 2015],
       'Gender' : ['Male', 'Female', 'Male', 'Male']
       }

data_df = pd.DataFrame(data, index = ['one', 'two', 'three', 'four'])
data_df
data_df.iloc[0,0]

print('\n 맨 마지막 칼럼 데이터 [:, -1]\n', data_df.iloc[:,-1])
print('\n 맨 마지막 칼럼을 제외한 모든 데이터 [:, :-1]\n', data_df.iloc[:, :-1])
머신러닝 학습 데이터의 맨 마지막 칼럼이 타겟 값인 경우가 많음
iloc[:, -1]을 하면 맨 마지막 칼럼의 값인 타겟 값만 가져오고, iloc[:, :-1]을 하게 되면 처음부터 맨 마지막 칼럼을 제외한 모든 칼럼의 값인 피처값들을 가져올 수 있게 된다
iloc[]은 슬라이싱과 팬시 인덱싱은 제공하나 명확한 위치 기반 인덱싱이 사용되어야 하는 제약으로 인해 불린 인덱싱은 제공하지 않는다
loc[]은 명칭 기반 인덱싱으로 슬라이싱 기호 ':'를 적용할 때 유의해야함
iloc[]와 다르게 loc[]은 불린 인덱싱이 가능
data_df.loc[data_df.Year >= 2014]
loc[]은 행 위치에 DataFrame 인덱스가 오며, 열 위치에는 칼럼명을 지정해 원하는 데이터를 반환
iloc이나 loc과 같이 명확하게 인덱싱을 지정하는 방식보다는 불린 인덱싱에 의존해 데이터를 가져오는 경우가 더 많다
titanic_df = pd.read_csv('titanic_train.csv')
titanic_boolean = titanic_df[titanic_df['Age'] > 60]
print(titanic_boolean)
titanic_boolean
titanic_df[titanic_df['Age']>60][['Name', 'Age']].head(3)
titanic_df.loc[titanic_df['Age']>60, ['Name', 'Age']].head(3)
titanic_df[(titanic_df['Age']>60) & (titanic_df['Pclass']==1) &
          (titanic_df['Sex']=='female')]
- and 조건일 때는 &
- or 조건일 때는 |
- Not 조건일 때는 ~
정렬, Aggregation 함수, GroupBy 적용
titanic_sorted = titanic_df.sort_values(by=['Name'])
titanic_sorted.head(3)

titanic_sorted = titanic_df.sort_values(by=['Pclass', 'Name'], ascending = False)
titanic_sorted.head(3)
titanic_df.count()

titanic_df[['Age', 'Fare']].mean()

titanic_groupby = titanic_df.groupby(by='Pclass')
print(type(titanic_groupby))

titanic_groupby = titanic_df.groupby('Pclass').count()
titanic_groupby
titanic_df = pd.read_csv('titanic_train.csv')
titanic_groupby = titanic_df.groupby('Pclass')[['PassengerId','Survived']].count()
titanic_groupby

titanic_df.groupby('Pclass')['Age'].agg([max,min])
agg_format = {'Age':'max', 'SibSp':'sum', 'Fare':'mean'}
titanic_df.groupby('Pclass').agg(agg_format)
- groupby()는 agg() 내에 입력값으로 딕셔너리 형태로 aggregation이 적용될 칼럼들과 aggregation 함수를 입력
결손 데이터 처리하기
titanic_df.isna().head(3)
titanic_df.isna().sum()
titanic_df['Cabin'] = titanic_df['Cabin'].fillna('C000')
titanic_df.head(3)
titanic_df['Age'] = titanic_df['Age'].fillna(titanic_df['Age'].mean())
titanic_df['Embarked'] = titanic_df['Embarked'].fillna('S')
titanic_df.isna().sum()
apply lambda 식으로 데이터 가공
판다스는 apply 함수에 lambda식을 결합해 DataFrame이나 Series의 레코드별로 데이터를 가공하는 기능 제공
lambda식은 파이썬에서 함수형 프로그래밍을 지원하기 위해 만들어짐
def get_square(a):
    return a**2

print('3의 제곱은:', get_square(3))
함수명과 입력 인자를 먼저 선언하고 이후 함수 내에서 입력 인자를 가공한 뒤 결과값을 return 문법으로 반환해야함
lambda는 이러한 함수의 선언과 함수 내의 처리를 한 줄의 식으로 쉽게 변환
lambda_square = lambda x : x**2
print('3의 제곱은:', lambda_square(3))
여러 개의 값을 입력 인자로 사용해야 하면 map()함수를 결합하여 사용
a = [1,2,3]
squares = map(lambda x : x**2, a)
list(squares)
titanic_df = pd.read_csv('titanic_train.csv')
titanic_df['Name_len'] = titanic_df['Name'].apply(lambda x : len(x))
titanic_df[['Name', 'Name_len']].head(3)
titanic_df['Child_Adult'] = titanic_df['Age'].apply(lambda x : 'Child' if x <= 15 else 'Adult')
titanic_df[['Age', 'Child_Adult']].head(8)
titanic_df['Age_cat'] = titanic_df['Age'].apply(lambda x : 'Child' if x<= 15 else ('Adult' if x<= 60 else 'Elderly'))
titanic_df['Age_cat'].value_counts()
def get_category(age):
    cat = ''
    if age <= 5:
        cat = 'Baby'
    elif age <= 12:
        cat = 'Child'
    elif age <= 18:
        cat = 'Teenager'
    elif age <= 25:
        cat = 'Student'
    elif age <= 35:
        cat = 'Young Adult'
    elif age <= 60:
        cat = 'Adult'
    else:
        cat = 'Elderly'

    return cat

titanic_df['Age_cat'] = titanic_df['Age'].apply(lambda x : get_category(x))
titanic_df[['Age', 'Age_cat']].head()